Setting up Prometheus and Grafana using Docker
In this post, I will explain how to setup Prometheus, Grafana and Node exporter using Docker and visualize some metrics


Prometheus and Grafana for Homelab monitoring is not as difficult as you think. It literally takes 10 minutes to get everything up
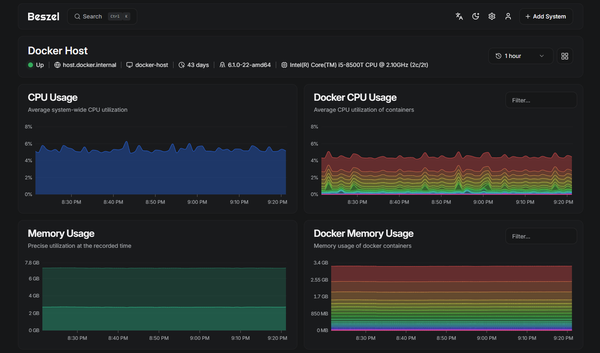
If you want to try something slightly simpler, you can give Beszel a try too. Check it out Simple monitoring with Beszel
Requirements
- A Linux Machine / VM with Docker installed. If you do not have docker installed, you can follow this
Architecture
Before we set it up, I think it makes sense to get an idea of how everything fits together. If you are already familiar with Grafana/Prometheus, feel free to skip this part
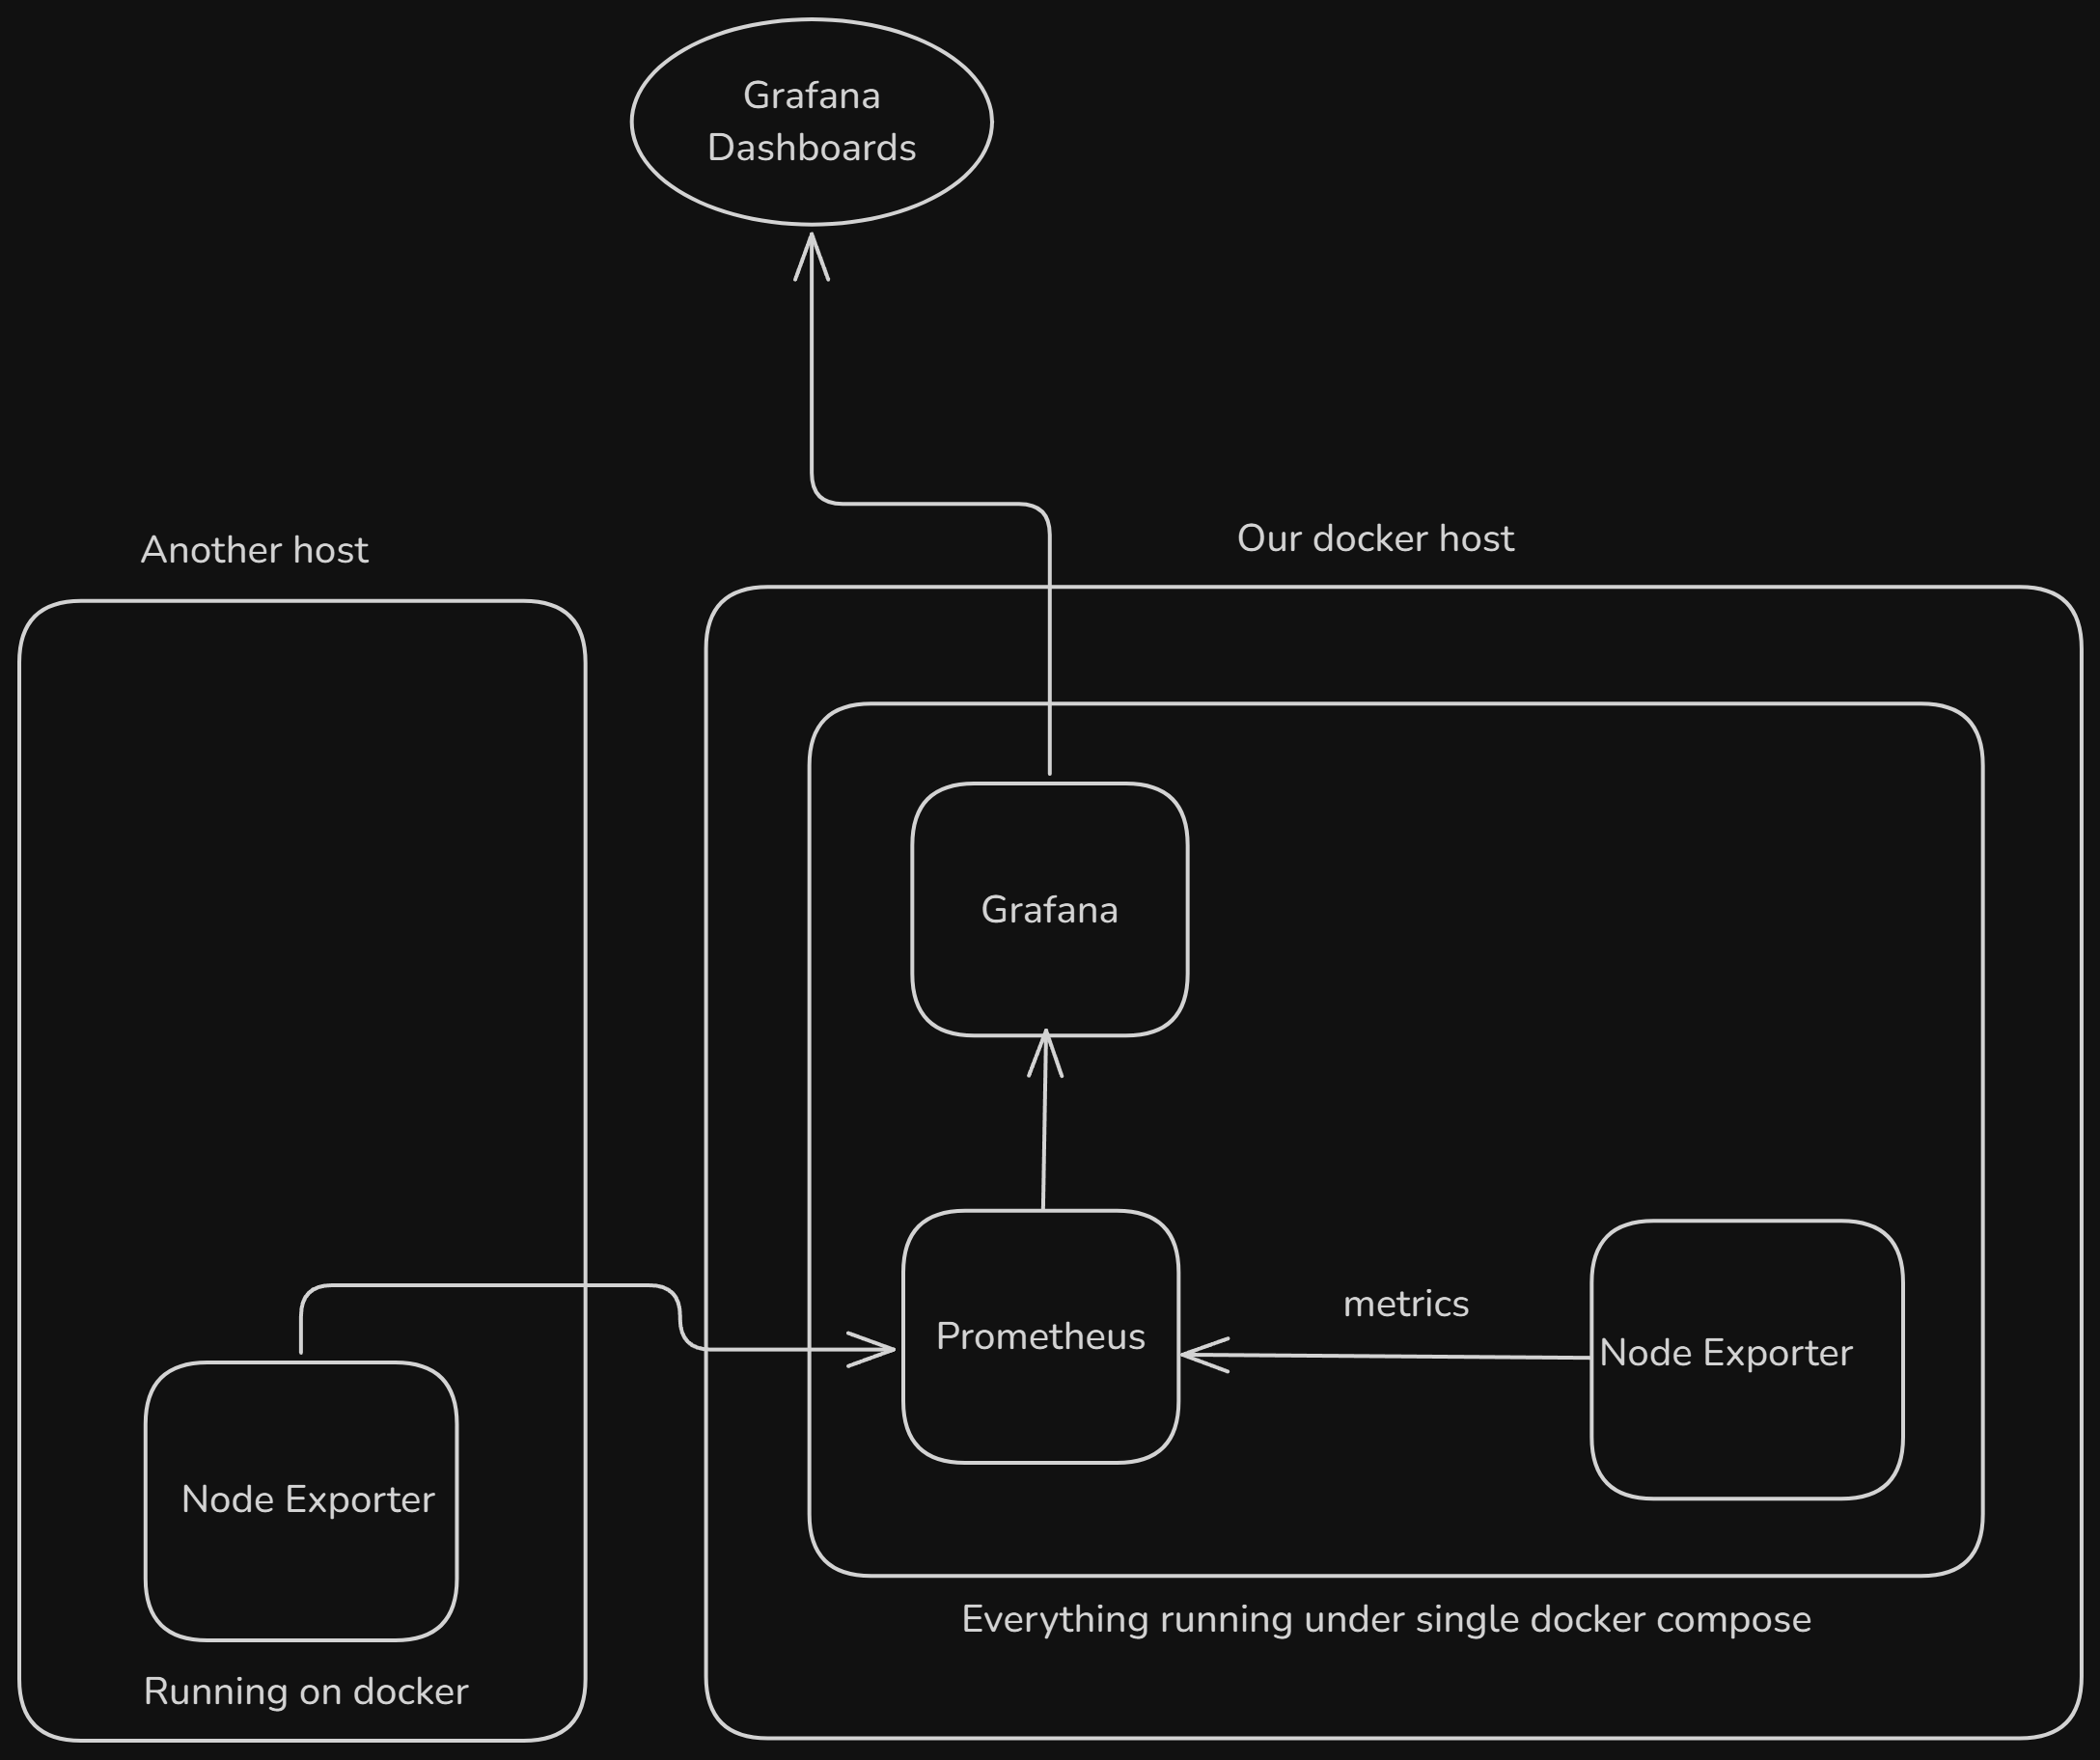
Node Exporter
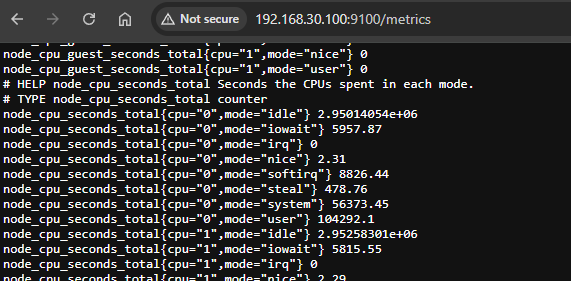
This is a simple service that grabs all the system metrics such as CPU usage, Memory, disk and much more. It then exposes these metrics on a port on the host where it is running. By default it runs on port 9100.
So, if you install node_exporter on a machine, start it and visit ip-address:9100/metrics, you will be able to see all these metrics, like this
Prometheus
This is our "metrics database". All these metrics generated by the node_exporter and other "exporters" will be periodically "scraped" by prometheus and store in its database.
That's right, Prometheus will go around and reading metrics from each of these "targets".
Grafana
This is where we will see all of our metrics in beautiful dashboards!
Setting it up
I will use a directory named monitoring in the home directory of my VM.
This will be our directory structure
.
├── compose.yaml
├── grafana
│   └── datasource.yml
├── prometheus
│   └── prometheus.yml
└── README.md
First, let us create those directories
mkdir {grafana,prometheus}Create the datasource config file
This is the config file that will tell Grafana where to look for metrics
cat > grafana/datasource.yml <<EOF
apiVersion: 1

datasources:
- name: Prometheus
  type: prometheus
  url: http://prometheus:9090
  isDefault: true
  access: proxy
  editable: true

EOF
Create the Prometheus config file
By default we are only adding the barebone configs. What we are interested in is under the scrape_configs. This is where we tell Prometheus all the targets that it needs to scrape metrics from. For now, we have only two targets. first one is the Prometheus server itself. The second one is the host where all these docker containers are running
cat > prometheus/prometheus.yml <<EOF
global:
  scrape_interval: 15s
  scrape_timeout: 10s
  evaluation_interval: 15s
alerting:
  alertmanagers:
  - static_configs:
    - targets: []
    scheme: http
    timeout: 10s
    api_version: v2
scrape_configs:
- job_name: prometheus
  honor_timestamps: true
  scrape_interval: 15s
  scrape_timeout: 10s
  metrics_path: /metrics
  scheme: http
  static_configs:
  - targets:
    - localhost:9090

  # Scrape our docker host itself
- job_name: 'docker-host'
  static_configs:
    - targets: ['node-exporter:9100']

EOF
Create the compose file
compose.yaml is the new docker-compose.yaml, so let us create that
cat > compose.yml <<EOF
services:
  prometheus:
    image: prom/prometheus
    container_name: prometheus
    command:
      - '--config.file=/etc/prometheus/prometheus.yml'
    ports:
      - 9090:9090
    restart: unless-stopped
    volumes:
      - ./prometheus:/etc/prometheus
      - prom_data:/prometheus
  grafana:
    image: grafana/grafana
    container_name: grafana
    ports:
      - 3000:3000
    restart: unless-stopped
    environment:
      - GF_SECURITY_ADMIN_USER=admin
      - GF_SECURITY_ADMIN_PASSWORD=grafana
    volumes:
      - ./grafana:/etc/grafana/provisioning/datasources
      - grafana_data:/var/lib/grafana

  node-exporter:
    image: prom/node-exporter:latest
    container_name: node-exporter
    restart: unless-stopped
    volumes:
      - /proc:/host/proc:ro
      - /sys:/host/sys:ro
      - /:/rootfs:ro
    command:
      - '--path.procfs=/host/proc'
      - '--path.rootfs=/rootfs'
      - '--path.sysfs=/host/sys'
      - '--collector.filesystem.mount-points-exclude=^/(sys|proc|dev|host|etc)($$|/)'
    expose:
      - 9100
volumes:
  prom_data:
  grafana_data:

EOF
Let us talk a second to talk about what we have in the compose.yaml file
- We have Prometheus, where we store the metrics
- We have Grafana where we visualize our metrics
- And we have a
node-exportercontainer that reads all the host metrics (look at the volume mounts, it is reading directly from the host)
Bring it up!
We can start the containers now
docker compose up -dWe can tail the logs in a different terminal window using. Watch out for any errors
docker compose logs -fCreating some Grafana Dashboards
You should be able to access Grafana at your-ip:3000 with the username and password specified in the compose.yaml file
Once logged into Grafana, go to Dashboards and Create Dashboard and then Import dashboard and put in the number 1860 and Load. What's 1860, you might ask, it is simply the dashboard ID for a beautiful dashboard shows all the metrics from node_exporter. You can find it here
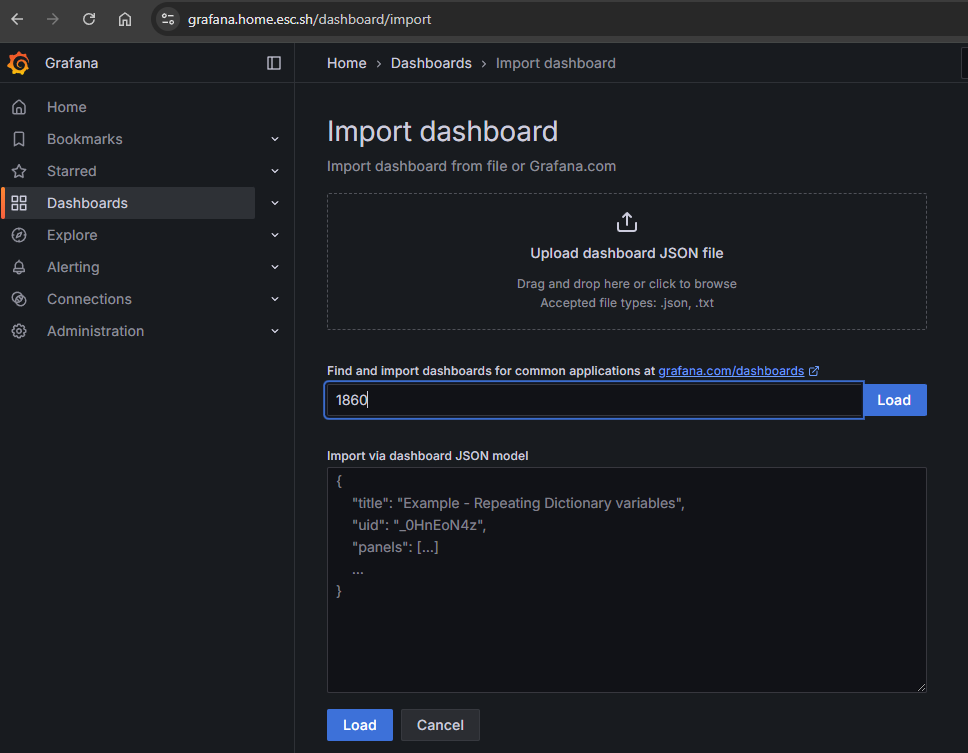
On the next page, it will ask you to choose the data source, choose Prometheus and click Import and you should be able to see a dashboard with wayyy too much metrics visualized
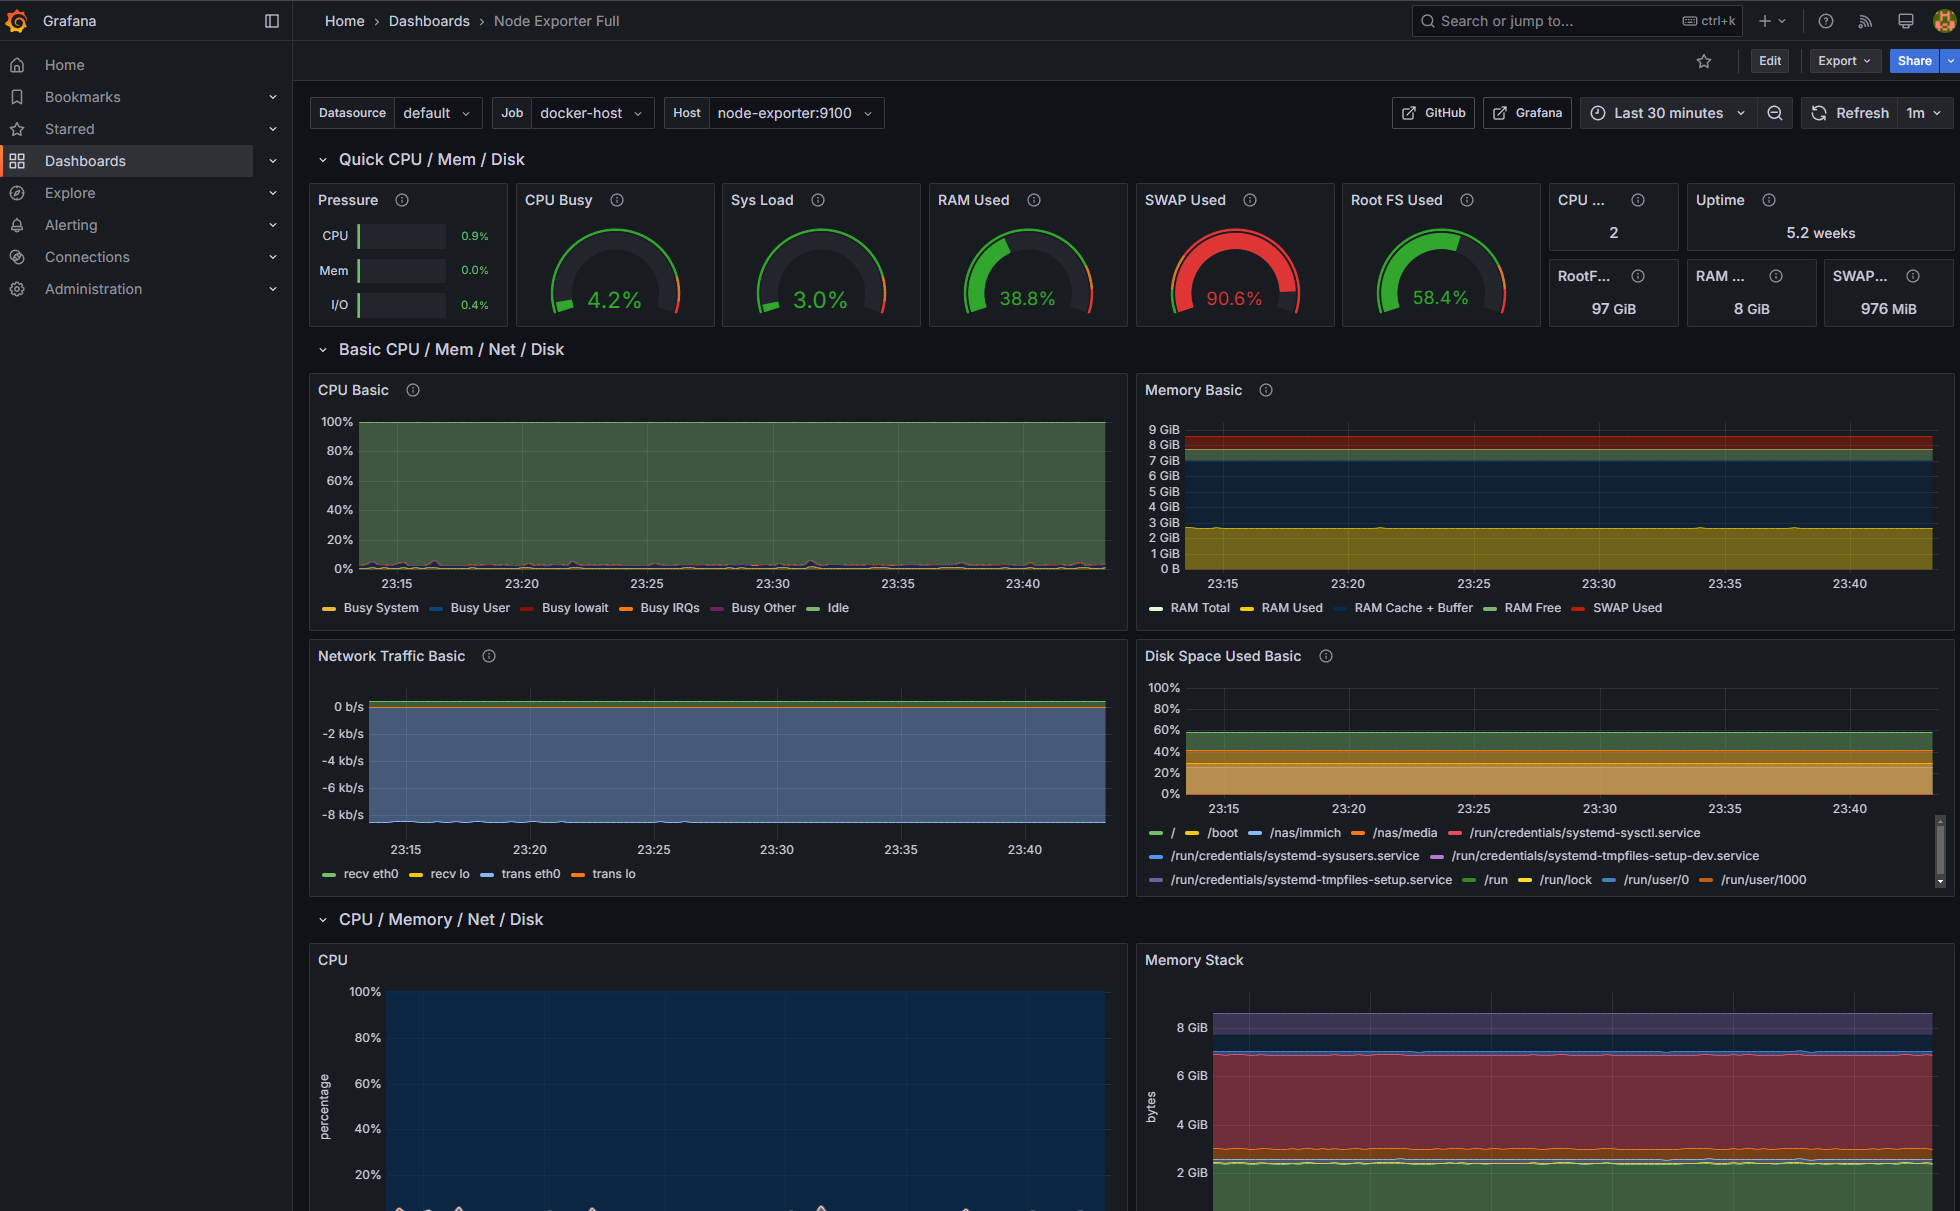
You should be able to edit the dashboards to your liking.
Adding more hosts to monitoring
If you have another Linux host to monitor, simply run the node_exporter on that host using docker and add it to the prometheus.yml like we did for the docker-host.
You can find a huge list of exporters HERE, so if you find the one you are looking for, you can follow similar procedures to get them visualized in Grafana.
Adding a reverse proxy
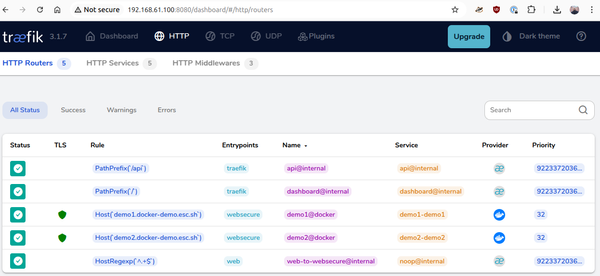
You can use Traefik as a reverse proxy with automatic TLS to your Grafana instance. Checkout this post

Good luck! Leave a comment if you have any questions